
Turnover Is Not Profit: How to See Which Products and Customers Actually Generate Profit

Cloud platform for business management
At first glance, growing sales look like a sure sign that the business is moving in the right direction. Orders are increasing, the team is busy, and the monthly reports show good results.
But more revenue does not always mean more profit. A company can sell more and still earn less, because between the sale and the bottom line stand costs for delivery, warehousing, production, transport, discounts, warranty claims, after-sales service, and the team’s time.
That is why the question is not only: “How much did we sell?”
The more important question is: “Which products, customers, and orders actually leave a profit after all costs?”
Why turnover can be misleading
Turnover shows the value of sales, but it does not show what remains for the company after the costs associated with those sales.
A product with high turnover may look successful, yet in reality carry a low profit margin.
This often happens when the sale involves:
- large trade discounts;
- expensive transport;
- frequent warranty claims;
- high warehousing costs;
- additional after-sales service;
- goods sitting in the warehouse for a long time;
- more time for processing and coordination.
The same applies to customers.
A customer with large orders is not always the most profitable customer. If they require special conditions, longer payment terms, frequent deliveries, constant discounts, or more service, the actual result can differ significantly from what the turnover shows.
High sales create a sense of growth. But without margin analysis, the company can hardly see where it earns and where it loses value.
That is why managing on the basis of sales alone is incomplete. Better decisions require information broken down by the individual sources of revenue and cost.
When costs change, the old reference points are no longer enough
In a more stable environment, many companies work with established pricing rules.
Management usually has an approximate idea of how much a given product costs, what margin is expected from it, and at what price a sale would be worthwhile. In most cases, it is also known which products traditionally generate profit and which customers require more of the team’s time, attention, and resources.
But when the prices of materials, energy, transport, labour, and external services change more frequently, these reference points can quickly become outdated, and high turnover can turn into heavy losses.
According to Eurostat data on industrial producer prices for April 2026, industrial producer prices in the EU rose by 4.9% year on year, with Bulgaria among the countries with the highest annual increase — 14.5%.
These figures do not mean that every company is affected in the same way. But they show why managing costs, cost of goods, and margins is becoming increasingly important.
When the purchase price of materials changes, it affects the production cost. If the cost goes up while the selling price stays the same, the margin shrinks.
The same happens when:
- transport becomes more expensive;
- the warehouse holds slow-moving goods;
- production deviates from the planned costs;
- trade discounts become too large;
- after-sales service costs for certain products or customers increase.
At the level of the overall financial statements, these changes are often seen late. At the level of product, customer, or order, they can be analysed much earlier – but only if the data is properly connected.
Financial accounting is necessary, but management needs more
Financial accounting is mandatory and important. It provides structure, reporting, and traceability for tax, regulatory, and financial purposes.
But management also needs management information.
The difference is practical:
- financial accounting shows the overall result;
- management information helps you understand how that result is formed;
- controlling helps trace where the business earns, where it loses margin, and where costs deviate from what was planned.
In OpenStax’s explanation of financial and managerial accounting, managerial accounting is presented as information for internal users who make and execute management decisions, while financial accounting is aimed at external reporting.
In day-to-day work, this means the company must be able to analyse not only the overall profit, but also the results of the individual units and processes that influence it.
What the problem looks like in a real business
Imagine a manufacturing or trading company with several product groups. One of them has high turnover, sells frequently, and in the monthly reports looks like a main source of revenue.
On closer analysis, however, it may turn out that sales of this group require larger discounts, more frequent deliveries, more after-sales service, or more coordination between departments. In this way, part of the turnover is gradually “eaten up” by costs that are not always clearly visible.
At the same time, another product group may have lower turnover but a more stable margin and lower servicing costs. If management looks only at turnover, the first group appears more successful. If it judges by profitability, the conclusion may be different.
This is exactly where management information helps you understand not only what is selling, but what is worth selling, developing, or reconsidering.
What data needs to be connected
To see the real profit, a single overall sales report is not enough. The data from the different parts of the business needs to be connected and to show not only what was sold, but also what costs stand behind that sale. This includes information from:
- sales — price, discounts, terms, and realised turnover;
- purchasing — purchase price of goods, materials, or services;
- warehouse — stock levels, movements, slow-moving goods, and availability;
- production — materials used, operations, labour, and variances, when the company manufactures;
- logistics and service — transport, deliveries, warranty claims, spare parts, and the team’s time, where applicable;
- accounting — invoices, payments, revenue, costs, the financial result, and the financial plan;
- human resources — payroll costs;
- controlling — cost of goods, margin, budget variances, and profitability.
When this data sits in separate spreadsheets, different systems, or manual reports, analysis becomes slow and unreliable. Different departments often work with different versions of the information: sales sees one thing, the warehouse another, accounting a third, and management receives the summarised picture too late — and in most cases the data is no longer up to date.
So the problem is not just a lack of data. The problem is often that the data is not connected in a way that allows timely and reliable management decisions.
When the data is connected, the company can see more clearly:
- what was sold;
- what costs stand behind the sale;
- what margin remains;
- which products are profitable;
- which customers require more resources;
- where there are deviations from the planned cost;
- which sales do not deliver the expected result.
When sales, the warehouse, production, logistics, and accounting work with separate data, management struggles to see true profitability. A connected system turns this data into a management picture.
How a connected system helps
For reliable profitability analysis, the company does not simply need one more report. It needs an environment in which day-to-day operations and financial data work together.
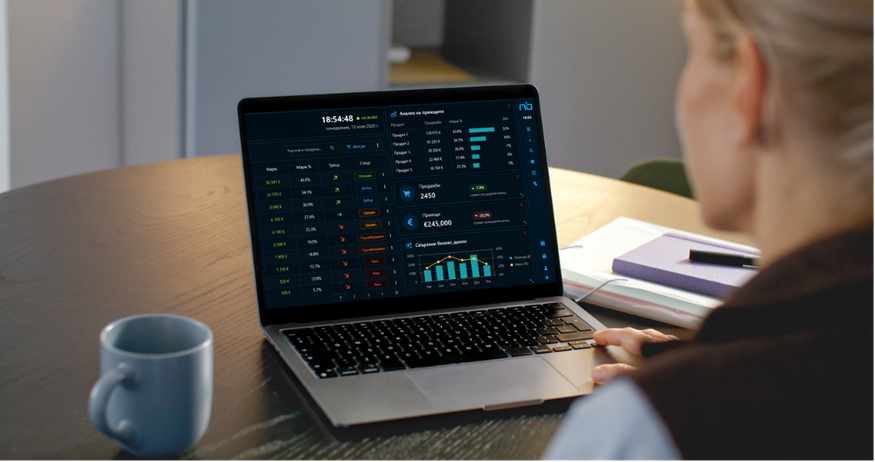
NewBIS supports this approach by connecting key business processes in a single cloud platform — sales, purchasing, warehouse, production, logistics, service, accounting, controlling, and management reports.
This way, management can track not only what was sold, but what costs stand behind every sale.
This enables margin analysis by:
- product;
- customer;
- order;
- service;
- warehouse;
- production operation;
- region;
- business line.
When the purchase price of materials changes, a manufacturing company can more easily see how this affects the production cost of the finished product.
With larger trade discounts, it can track what real margin remains after the sale.
With transport or service costs, it can analyse which customers, regions, or product groups require more resources.
“A connected system does not make decisions instead of management.
It provides a clearer basis for making them.”
This is especially important for growing companies. The more products, customers, warehouses, suppliers, orders, and operations a business has, the harder it becomes to manage with overall reports, separate files, and manual reports alone.
Frequently asked questions
Does turnover show the real profit?
No. Turnover shows the value of sales, but it does not show the cost of goods, discounts, transport, warehousing costs, warranty claims, servicing, and the other costs associated with the sale.
What does product profitability mean?
It is an analysis of which products leave a real profit margin after deducting the related costs, not just which products sell the most.
When does a company need a more connected management system?
When reports are prepared manually, departments work with different data, margins are unclear, or management finds out too late where profit is being lost.
How does an integrated ERP system help with margin analysis?
By connecting sales, purchasing, warehouse, production, logistics, accounting, payments, and controlling, so that the analysis of cost and profit margin is based on unified information.
Time for a clearer picture
When a business grows, overall turnover is no longer a sufficient guide. Management needs to see which sales create the profit margin, which erode it, and how operating costs affect the bottom line.
In a period of price pressure, changing costs, and more complex processes, companies need clearer visibility of profit — not only at company level, but in the connection between sales, operations, and the financial result.
The first step is to review where the information about sales, costs, warehouse movements, production, transport, service, and payments is created, and whether this data can be used for management analysis rather than reporting alone.
NewBIS solutions help companies build a more connected environment in which management works with a clearer and more timely picture of profitability, cost, profit margins, and operational processes.
Because good management does not stop at the question:
“How much did we sell?”
It looks for the answer to the more important question:
“Where do we really earn, and where do we lose?”
Want a clearer picture of profitability by product, customer, and order?
Book a meeting with a NewBIS consultant and discuss how connected data — from production and sales to accounting and controlling — can support more informed management of your business.
